
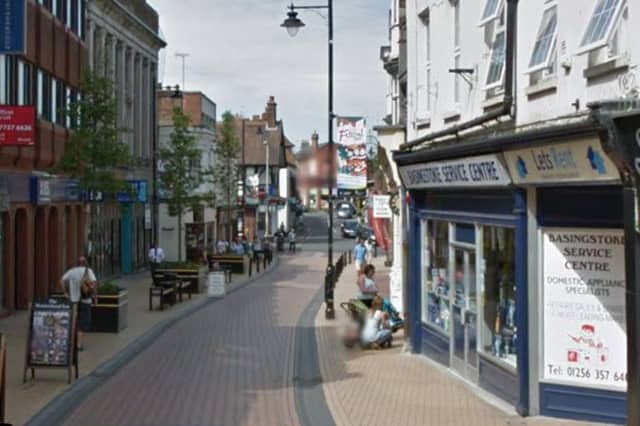


The latest figures show how house prices have soared in some areas of the county by between 30% and 50% during the past half a decade.
We’ve crunched the numbers to compile a list of the 13 neighbourhoods within Hampshire where prices rose by the biggest percentage between September 2019 and September 2024, the latest date for which localised housing statistics are available.
They range from districts of Portsmouth, Southampton and Winchester to more rural spots in Test Valley and the New Forest.
The figures are taken from house price data published by the Office for National Statistics.
The average house price in the areas that make our list ranges from £200,000 to £850,000.
Scenic locations, good schools, and popular shops, pubs and restaurants are among the factors driving prices up in those areas.
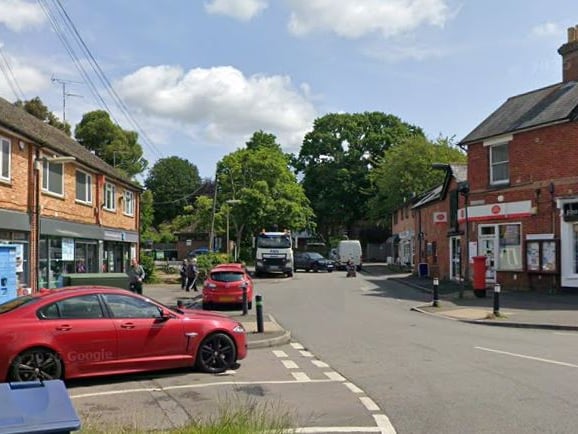
5. Bransgore and Burley, New Forest - 34.8% increase
The average house price in Bransgore and Burley, in the New Forest, has risen by 34.8% during the last five years, to £600,000. That's the 9th biggest percentage increase in Hampshire. | Google Photo: Google
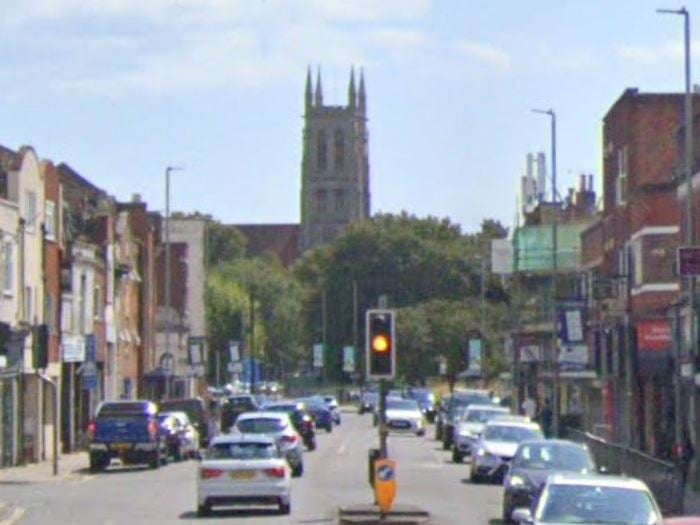
6. Fratton West, Portsmouth - 34.9% increase
The average house price in Fratton West, Portsmouth, has risen by 34.9% during the last five years, to £212,500. That's the 8th biggest percentage increase in Hampshire. | Google Photo: Google
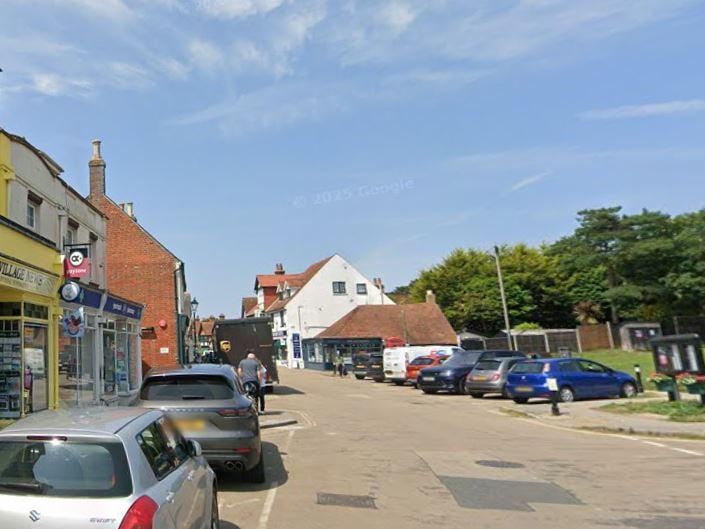
7. Milford & Lymington South - 35.3% increase
The average house price in Milford & Lymington South, in the New Forest, has risen by 35.3% during the last five years, to £622,500. That's the 7th biggest percentage increase in Hampshire. | Google Photo: Google
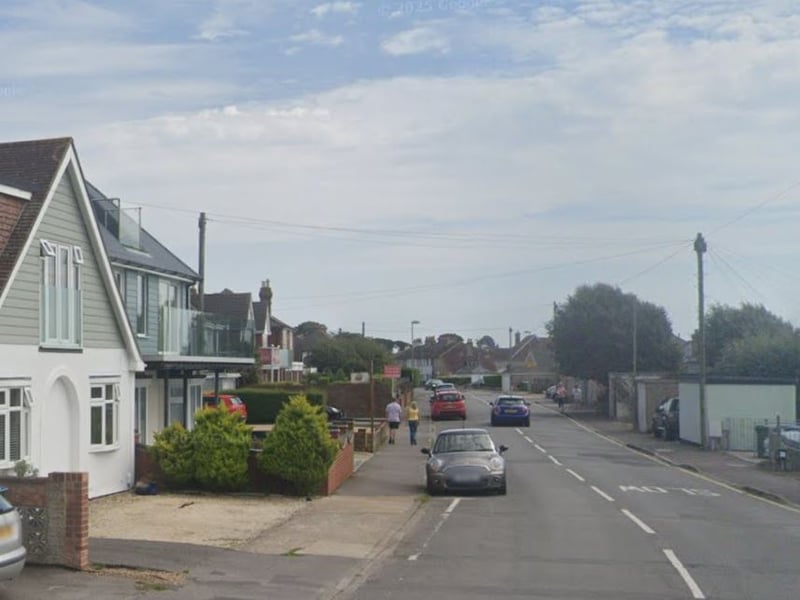
8. Hill Head, Fareham - 35.8% increase
The average house price in Hill Head, Fareham, has risen by 35.8% during the last five years, to £455,000. That's the 6th biggest percentage increase in Hampshire. | Google Photo: Google