

The data comes from the government’s interactive map – which can be viewed here.
It shows how many cases there have been in each postcode area across Portsmouth and Southsea in the seven days to October 16.
A total of 290 Covid cases were confirmed in the city during that time.
MORE COVID NEWS: Latest infection rates in Portsmouth and Hampshire | List of confirmed cases across county in last day | Current coronavirus hotspots in Hampshire
We have listed the areas in alphabetical order.
Make sure to click through all of the pages in our gallery below.
The News is more reliant than ever on you taking out a digital subscription to support our journalism. You can subscribe here for unlimited access to Portsmouth news and information online.
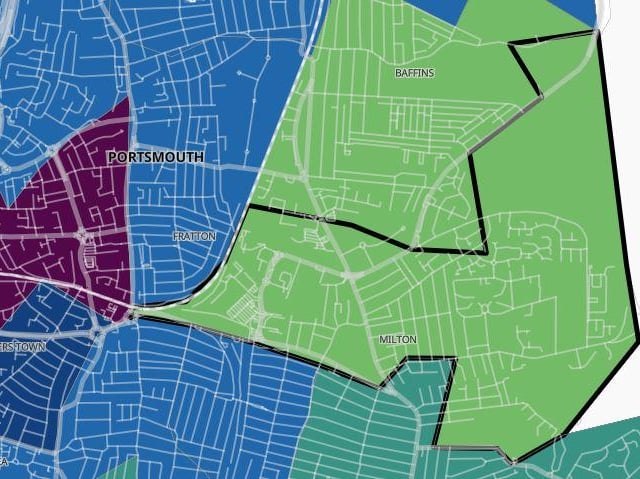
13. Milton
Milton had four confirmed cases in the seven days to October 16, which was an increase of 100 per cent. Photo: Government Covid map
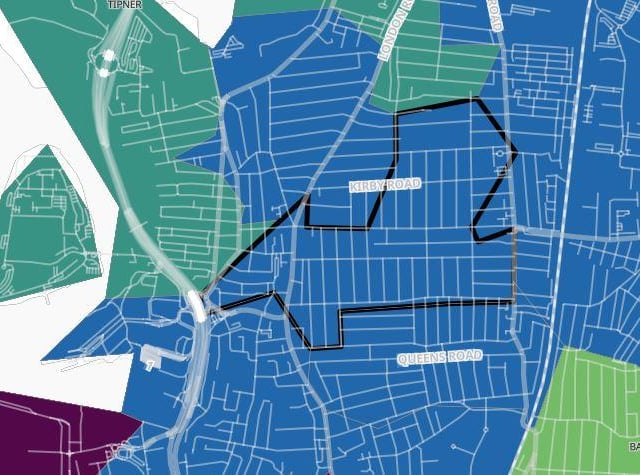
14. North End East
North End East had nine confirmed cases in the seven days to October 16, which was an increase of 50 per cent. Photo: Government Covid map
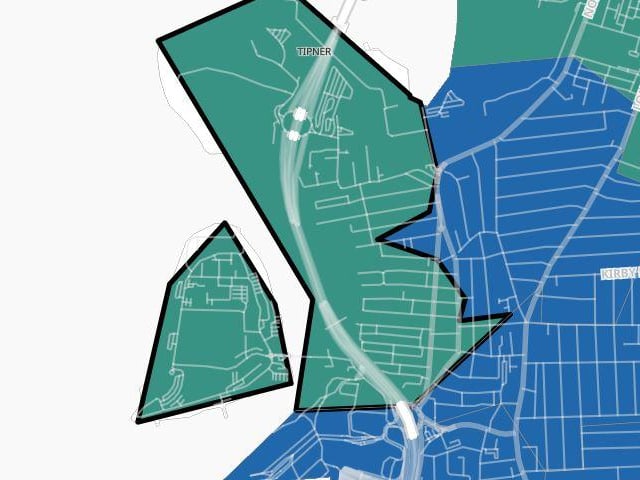
15. North End East and Whale Island
North End East and Whale Island had three confirmed cases in the seven days to October 16, which was a decrease of 25 per cent. Photo: Government Covid map
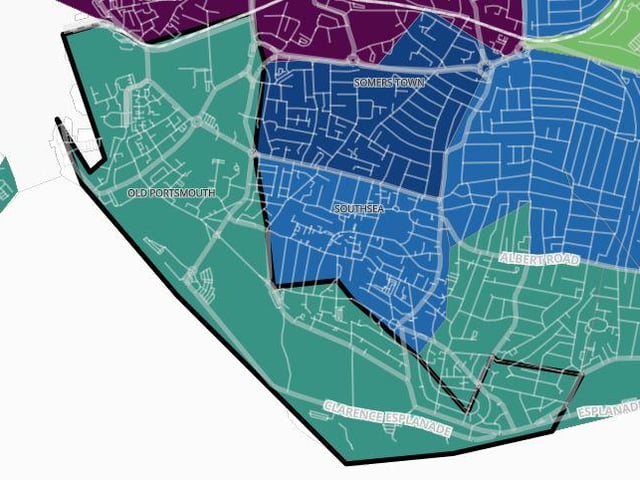
16. Old Portsmouth and Southsea Common
Old Portsmouth and Southsea Common had five confirmed cases in the seven days to October 16, which was a decrease of 28.8 per cent. Photo: Government Covid map