
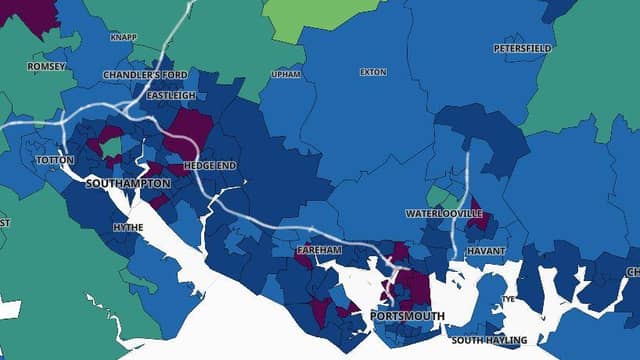

A map on the Covid dashboard website shows how high rates were on January 2 and how much they had decreased by on February 9.
We have pulled together a comparison between before lockdown began and after weeks of the restrictions.
MORE: coronavirus coldspots where infection rates are lowest in Hampshire | 9 Portsmouth neighbourhoods with most coronavirus cases
You can see that in our gallery below.
Make sure to click through all the pages.
We have included a key to explain what the colours mean.
You can subscribe here for unlimited access to Portsmouth news online - as well as fewer adverts, access to our digital edition and mobile app.
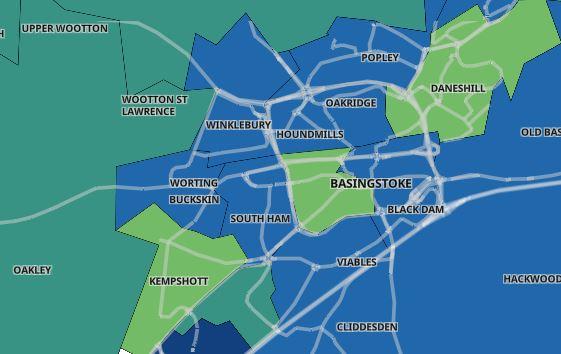
17. Basingstoke
On February 9, the rate had fallen below 199 in the majority of areas and below 49 in three areas. Photo: -
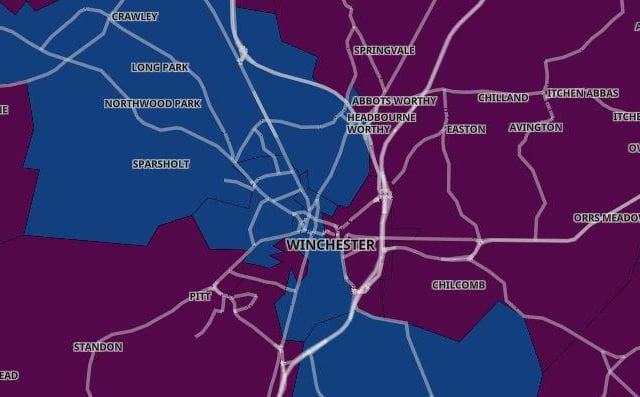
18. Winchester
On January 2, many of the areas had a rate of 200 or higher, with the rate above 400 in a number of areas. Photo: -
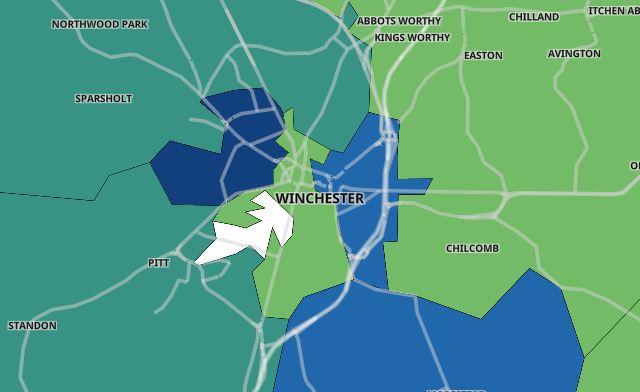
19. Winchester
On February 9, the majority of areas had a rate below 100 and the virus was ‘suppressed’ in one area. Photo: -
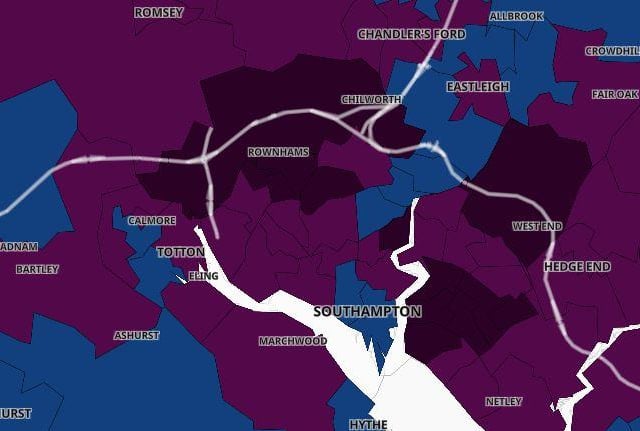
20. Southampton
On January 2, the majority of areas had a rate of 400 or higher, with a number of areas having a rate of 800 and above. Photo: -