
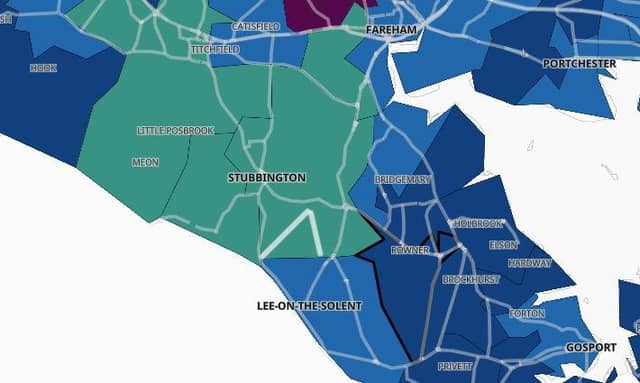

In the figures, the towns are broken down into different districts such as Bridgemary North and Elson.
It shows the number of cases recorded in the seven days to November 13 and the rate at which it is rising or decreasing compared to the week previous.
COVID LATEST: 19 areas where cases are rising in Portsmouth | Latest coronavirus case numbers for Hampshire | Covid infection rates ranked from lowest to highest in Hampshire | 18 biggest coronavirus hotspots in Hampshire
We have collected the data into an easy to view gallery which you can see below – make sure to click through all the pages.
The areas are listed from the places with lowest rise in cases to the areas with the largest.
You can subscribe here for unlimited access to Portsmouth news online - as well as less adverts, access to our digital edition and mobile app.
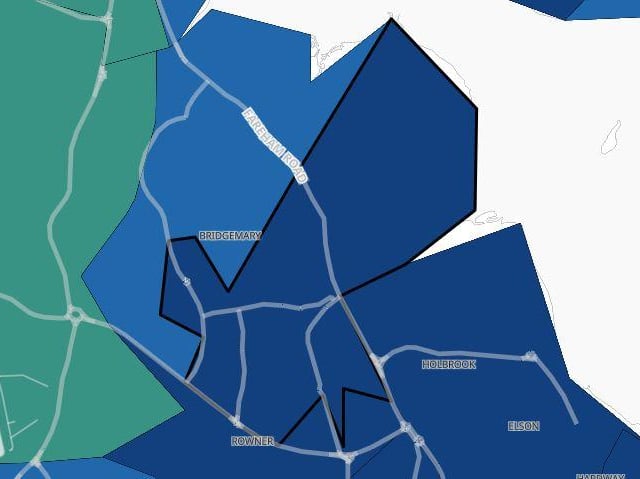
9. Bridgemary South
Cases rose by 66.7 per cent in Bridgemary South in the seven days to November 13 - up 8 to 20. Photo: -
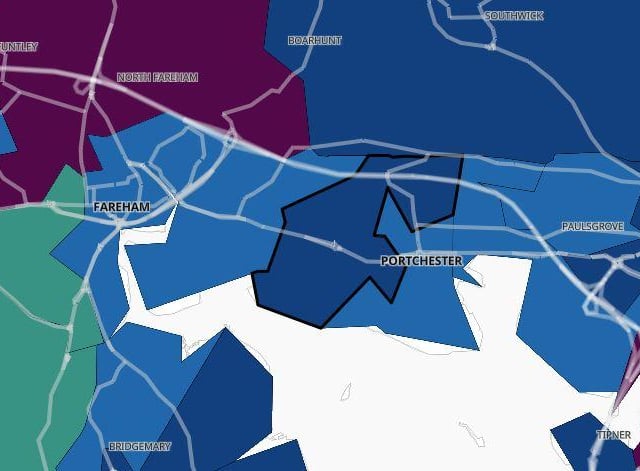
10. Portchester North West
Cases rose by 66.7 per cent in Portchester North West in the seven days to November 13 - up 8 to 20. Photo: -
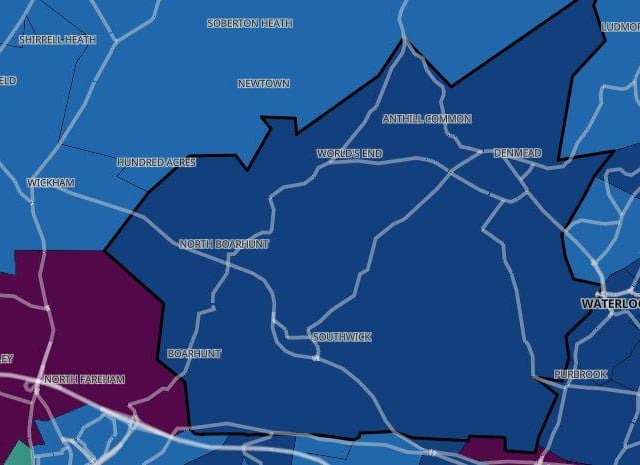
11. Denmead and Southwick
Cases rose by 69.2 per cent in Denmead and Southwick in the seven days to November 13 - up 9 to 22. Photo: -
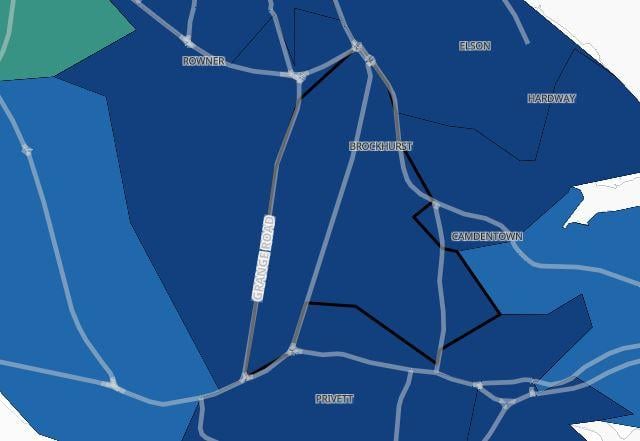
12. Brockhurst
Cases rose by 70 per cent in Brockhurst in the seven days to November 13 - up 7 to 17 Photo: -