


The latest official primary school league table sees each school awarded a score out of 120 for SAT assessments in reading and maths. The average 'scaled’ scores' refer to Key Stage 2 assessments taken by pupils at the end of Year 6 in the summer of 2024.
Take a look at the 33 best and worst performing Portsmouth primary schools:
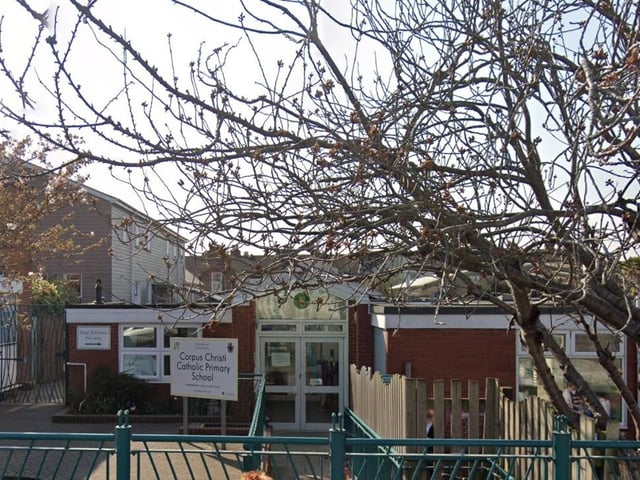
9. Corpus Christi Catholic Primary School, Portsmouth
Corpus Christi Catholic Primary School had 60 per cent of pupils meeting expected standards for reading, writing and maths. The average score in reading was 105 and in maths it was 103. Photo: Google
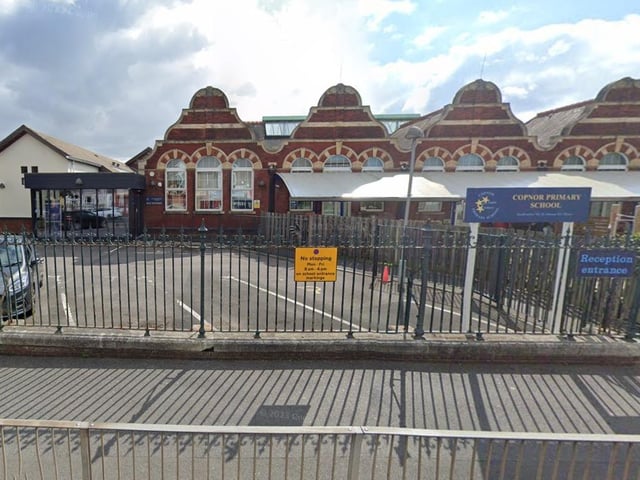
10. Copnor Primary School, Portsmouth
Copnor Primary School had 58 per cent of pupils meeting expected standards for reading, writing and maths. The average score in reading was 104 and in maths it was 103. Photo: Google
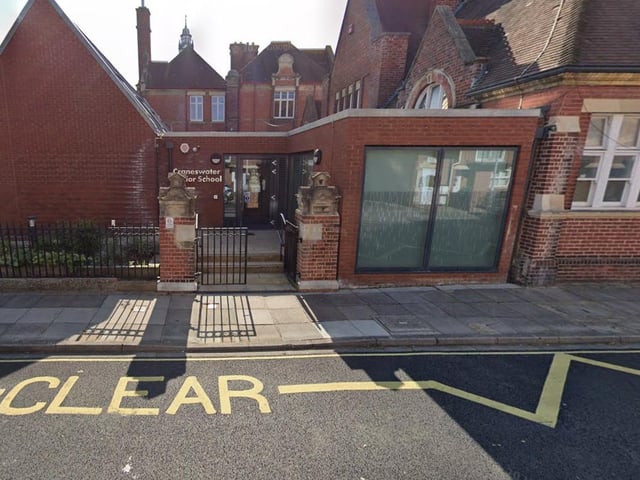
11. Craneswater Junior School, Southsea
Craneswater Junior School had 57 per cent of pupils meeting expected standards for reading, writing and maths and 2 per cent of the students achieved a higher standard.The average score in reading was 106 and in maths the average score was 104. Photo: Google
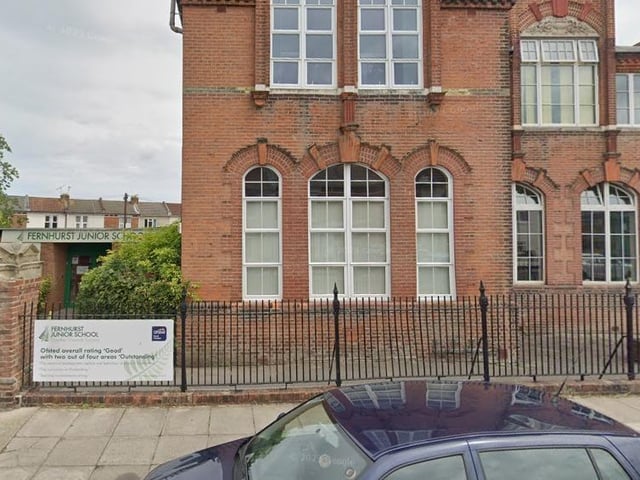
12. Fernhurst Junior School, Southsea
Fernhurst Junior School had 57 per cent of pupils meeting expected standards for reading, writing and maths and 1 per cent achieved a higher standard. The average score in reading was 104 and in maths it was 103. Photo: Google